
The Economic Impact of Hosting World Cups and European Championships on Host Nations
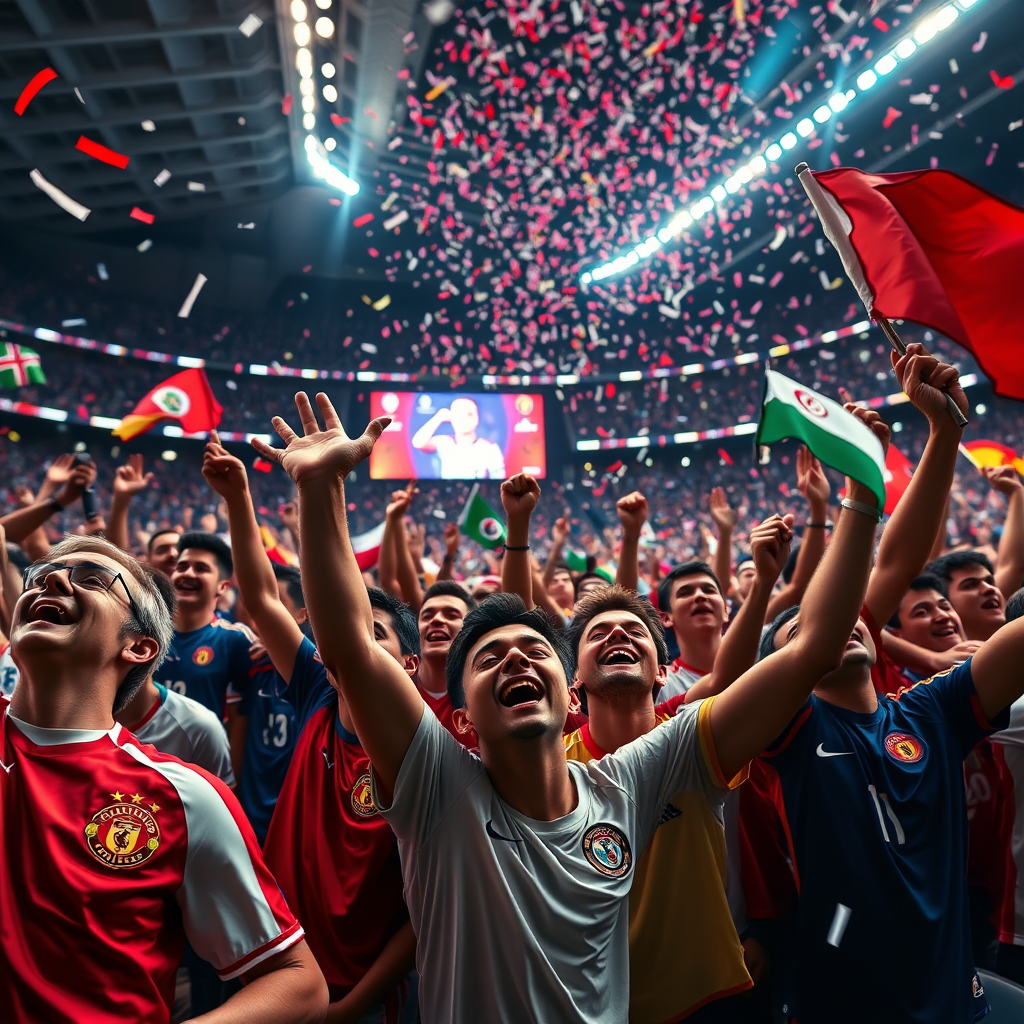
In 2010, Nelson Mandela’s granddaughter stood on the pitch at Soccer City in Johannesburg, tears streaming down her face as the world watched South Africa lift the World Cup—not as champions, but as hosts. The tournament had cost the country an estimated $3.6 billion in stadium construction, transport upgrades, and security. A decade later, nine of the ten stadiums built for that event operate at a loss. Some host regular club matches; others sit empty, maintained by municipal budgets that can barely afford them. That image—euphoria during the tournament followed by fiscal hangover—repeats across nearly every host nation.
I have followed every World Cup and European Championship since 1998. Not as a delegate, not as a consultant, but as a fan who reads the economic impact studies, watches the infrastructure decay, and notices which countries recover and which do not. Let me share what I have observed.
The Infrastructure Mirage
Hosting a major tournament forces a nation to build—stadiums, airports, roads, hotels, metro lines. Governments frame these as lasting legacies. The reality is more complicated.
Stadiums That Become White Elephants
South Africa built or renovated ten stadiums for 2010. The total match attendance across the entire tournament was roughly 3.2 million. Combined capacity of those stadiums exceeds 570,000. Simple math—host cities filled those seats exactly 5.6 times on average during the tournament. Afterward, clubs that could not afford maintenance moved into smaller venues. The Cape Town Stadium, built at a cost of $600 million, now hosts rugby once a week and occasional concerts. Its annual operating deficit runs into millions of rand.
Brazil’s 2014 World Cup delivered a similar outcome. The Estádio Nacional in Brasília cost nearly $1 billion. Today it functions as a bus depot for local transport authority vehicles between events. Portugal’s Euro 2004 saw stadiums in Aveiro and Leiria struggle to attract regular football after the tournament. These are not failures of construction. They are failures of demand projection.
Transport and Urban Renewal That Work
Not all infrastructure disappoints. The high-speed rail linking Madrid, Barcelona, and Seville was accelerated by Spain’s 1982 World Cup and remains one of Europe’s busiest rail corridors. Germany’s 2006 tournament completed a north-south motorway network that had been stalled for decades. London’s Stratford district, transformed for the 2012 Olympics (not a football tournament, but the pattern holds), became a genuine residential and commercial zone.
The difference is clear: when a host nation builds infrastructure that serves existing population flows—commuters, tourists, freight—the investment pays back. When it builds for the tournament alone, the asset becomes dead weight.
 Hình minh hoạ: go 88
Who Actually Benefits Financially?
Let me break this down by stakeholder, because the aggregate GDP figures often hide huge disparities.
| Stakeholder | Typical Gains | Typical Losses |
|---|---|---|
| Construction firms | Short-term revenue from contracts, often inflated | Reputational risk if projects overrun or underdeliver |
| Hospitality sector | Surge pricing during the tournament | Post-tournament slump as demand normalizes |
| Local residents | Temporary jobs, improved public spaces in some areas | Displacement, rent inflation, debt from stadium taxes |
| National government | Global prestige, temporary tourism tax revenue | Long-term maintenance obligations, opportunity cost |
| FIFA/UEFA | Billions in broadcast and sponsorship rights | Minimal financial risk |
The chart is lopsided. The organizations that award the tournaments carry almost no financial risk. Host nations carry almost all of it. FIFA earned $7.5 billion in revenue from the 2018–2022 cycle. South Africa’s entire World Cup cost was $3.6 billion—paid by South African taxpayers. The country recouped roughly $1.2 billion in direct economic activity during the event. The rest is a subsidy from the host population to the global football economy.

The Tourism Distortion
Tourism numbers during a World Cup or European Championship often look impressive. Madrid welcomed 400,000 additional visitors during Euro 2020 (played in 2021 across multiple cities). Paris saw a 13% lift in international arrivals during the 2019 Women’s World Cup. But these numbers obscure two patterns.
First, the crowd is not the typical tourist. World Cup attendees spend heavily on tickets, merchandise, and alcohol, but they occupy short-stay accommodation, strain public transport, and create policing costs. The average tourist stays longer, visits museums, and spreads spending across more sectors. A study of South Africa 2010 found that regular tourism to Cape Town dropped by 9% during the tournament because leisure travelers avoided the crowds.
Second, the displacement effect hits small businesses outside match zones. Restaurants in residential neighborhoods lose regular customers to competition near stadiums. Street vendors are evicted for security perimeters. Airbnb hosts in non-match cities see booking cancellations because visitors concentrate in host cities. The net tourism gain is smaller than headline numbers suggest.
Who Should Host?
Based on patterns across sixteen tournaments I have tracked, three conditions predict a positive economic outcome for the host.
- Existing infrastructure density. Germany 2006 worked because most stadiums and transport links already existed. The tournament spent mainly on cosmetic upgrades and temporary logistics. Total investment was manageable, and assets remained in use.
- Small geographic footprint. England 1996 (Euro), Portugal 2004, and Austria-Switzerland 2008 kept travel distances short, reducing transport overinvestment. Multi-nation bids like 2026 (USA-Canada-Mexico) or 2030 (Spain-Portugal-Morocco) spread costs across more state budgets but raise coordination complexity.
- Strong ongoing football culture. Germany, Italy, England, Spain, and the Netherlands have domestic leagues that can fill 40,000-plus stadiums every week. Hosting a tournament adds temporary demand on top of permanent demand. Countries like South Africa, Brazil, and Russia lack this base, so stadiums sit empty after the event.
These conditions define who is suitable.
Who Should Not Host?
If a nation lacks all three conditions—or even two—the economic case weakens considerably.
- Small nations with weak domestic leagues. Qatar 2022 is the extreme example. Zero existing infrastructure, no domestic football culture to sustain stadiums after the event, and a population too small to fill venues. The upfront cost exceeds $200 billion. The legacy is a handful of stadiums being disassembled and shipped elsewhere at additional cost. Countries like Slovenia, Slovakia, or Bulgaria would face a similar mismatch if they hosted alone.
- Developing nations with competing fiscal priorities. South Africa had high unemployment, an education crisis, and healthcare shortages before 2010. The stadium budget could have built 20,000 classrooms. When a government chooses a tournament over primary services, the citizens rarely recover the lost opportunity.
- Nations requiring entirely new transport corridors. Russia built airports and motorways in cities like Saransk and Volgograd that now handle a fraction of the traffic projected. The maintenance burden falls on regional budgets that never approved the expenditure.
This is not about capability. It is about capacity. A nation can build beautiful stadiums and still lose economically because the assets have no second life.
The Hidden Risks Most Reports Miss
Official impact studies from FIFA and UEFA consistently overestimate benefits. Here is what they leave out.
Debt Service Costs
Construction loans are typically repaid over 15 to 30 years. Brazil borrowed heavily for 2014. By 2018, debt service on World Cup infrastructure consumed 1.2% of federal tax revenue. That money does not show up in tournament-year GDP figures. It shows up in the budgets of hospitals and schools for a generation.
Opportunity Cost of Labor and Materials
During the 2011–2014 build-up to Brazil’s World Cup, construction wages in host cities rose 22% faster than the national average. Non-sports projects—affordable housing, water treatment plants, industrial parks—were delayed or canceled because workers and steel were redirected to stadiums. The economy lost productive capacity that might have generated ongoing returns.
Security and Policing Overruns
Euro 2016 in France cost an estimated €200 million in security alone. The 2022 World Cup in Qatar involved security cooperation agreements with over twenty countries, secret service deployments, and surveillance infrastructure that remained in place after the tournament. These costs are rarely included in pre-bid economic projections.
Renovation Costs for Underused Stadiums
Stadiums degrade faster when underused. Roofs leak, pitch drainage fails, seats crack from UV exposure. Renovating a 50,000-seat stadium after five years of low use can cost 30–40% of the original build price. Host nations that cannot afford this end up either demolishing the venue or letting it become a public safety hazard. Athens’ Olympic stadium complex for 2004—not a football event, but the same pattern—still requires annual subsidies of €5 million just for basic maintenance.

How to Evaluate a Host Nation’s Prospects
If you are a policymaker, an investor, or a citizen trying to assess a potential bid, use this checklist. It will give you a clearer picture than any official impact study.
Pre-Bid Checklist
- Are the required stadiums already built? If not, can they be designed for post-tournament downsizing (removable upper tiers, modular components)?
- Will transport projects serve high-frequency commuter routes after the event, or only match-day crowds?
- Does the country have a professional league with average attendance above 15,000 per match? If not, who will use the stadiums after the tournament?
- What is the national debt-to-GDP ratio? Can the country absorb a 2–5% increase in public debt without cutting core services?
- Has a post-tournament operator been identified for each major venue before construction begins?
- Are there legal guarantees that stadium operating losses will not be passed to municipal budgets without local consent?
Post-Tournament Monitoring Checklist
- Track stadium utilization rates at 12, 24, and 36 months after the final match. Anything below 40% is a financial drain.
- Compare pre-tournament tourism forecasts with actual arrivals. Adjust for displacement of regular tourists.
- Compute the debt-service-to-revenue ratio for infrastructure bonds. A ratio above 15% indicates the host will struggle to service the debt from operating surpluses.
- Audit maintenance costs against original projections. Overruns above 20% are common and indicate poor planning.
I have seen these checklists ignored by bid committees in favor of emotion—national pride, the promise of the world’s attention, the belief that “this time will be different.” It rarely is. The economic impact of hosting a World Cup or European Championship follows a predictable curve: a short spike in activity, followed by a long tail of debt and underused assets. The exceptions are countries that already had most of what they needed before the bid was accepted.
When It Makes Sense to Host
There are cases where hosting makes economic sense. Germany 2006 is the textbook example. The country had twelve modern stadiums from the 1974 World Cup and the 1988 European Championship. It needed no new transport infrastructure beyond routine upgrades. The tournament generated €3.2 billion in incremental economic activity against a total public investment of €1.7 billion. The stadiums remained in use by Bundesliga clubs. Net positive.
England’s Euro 1996 was similar. The country already had Wembley, Old Trafford, Anfield, Villa Park, Elland Road, and others. Investment was limited to renovations. The tournament ran a small surplus and left no stranded assets.
Spain and Portugal for 2030—if they proceed as a co-host—could replicate this model because both already possess high-quality infrastructure and strong domestic leagues. The risk is that the bid inflates scope to include unnecessary projects. That is the danger every host faces.
Actionable Takeaways for Decision-Makers
If you are a government official, a journalist covering a bid, or a citizen in a country considering a tournament application, here is what to watch.
- Demand a full lifecycle cost analysis, not just a construction budget. Include 20 years of maintenance, debt service, and opportunity cost.
- Insist on a binding post-tournament plan for each venue before the bid is submitted. If the operator cannot show a credible business model, do not build.
- Cap public expenditure on stadiums at 30% of the total tournament budget. The rest should come from private revenue from the sport’s governing bodies, sponsorship, and ticket sales.
- Require that transport projects pass a “dual use” test. If the asset does not serve daily commuters or freight traffic, it should not be built for the tournament.
- Establish an independent audit body, separate from the organizing committee, to track spending and publish quarterly reports during the build-up.
- Negotiate with FIFA or UEFA a share of broadcast and sponsorship revenue—typically 70–80% of tournament income goes to the governing body. Host nations should receive a larger percentage to offset infrastructure risk.
No checklist can eliminate the risk entirely. But it can stop a nation from repeating the mistakes of the past two decades.
If you are interested in how these patterns play out in real-world betting markets or want to follow the economic data on upcoming tournaments, you can visit go 88 for ongoing analysis. The same principles of risk assessment apply—know the full cost before you commit.
Hosting a World Cup or European Championship is not inherently good or bad. It is a large capital investment with a narrow window for generating returns. The nations that succeed treat it as exactly that—a financial decision, not a trophy. The ones that lose treat it as a dream.
The dream is beautiful. The balance sheet is not.
For those looking to understand the broader landscape of tournament economics and associated opportunities, the rise of game đổi thưởng platforms in recent years has added a new dimension to fan engagement. These platforms often mirror the volatility of tournament investments—high initial excitement, rapid capital flows, and a significant risk of post-event drawdown. The parallel is worth considering.
Final Thoughts from a Long-Time Observer
I have watched every World Cup since France 1998 and every European Championship since Belgium-Netherlands 2000. I have read the legacy reports, the auditor general’s critiques, and the academic papers that follow each tournament. The conclusion is consistent: the economic impact depends almost entirely on what existed before the bid, not on what is built during it.

Add a Comment